


| Follow @co2science |
Paper Reviewed
Asif, M., Yilmaz, O. and Ozturk, L. 2017. Elevated carbon dioxide ameliorates the effect of Zn deficiency and terminal drought on wheat grain yield but compromises nutritional quality. Plant and Soil 411: 57-67.
Most plant CO2-enrichment studies tend to only examine the singular effects of rising atmospheric CO2 on plant growth. Fewer are the studies that introduce other variables, such as temperature or soil water status, and even fewer are those that examine three or more variables. Seeking to fill the data void of this latter category, the scientific research team of Asif et al. (2017) recently set out to explore the combined effects of elevated CO2, drought and Zinc (Zn) supply on wheat (Triticum aestivum cv. Tahirova).
The experiment was conducted under controlled environment conditions at Sabanci University, Istanbul, Turkey. Wheat seeds were sown and grown under either ambient (400 ppm) or elevated (700 ppm) CO2 and adequate (2 mg kg-1 Zn applied to soil medium) or low (no additional Zn applied to soil medium) concentrations of Zn. Forty one days after sowing, half of the wheat plants growing under the different treatments were further subjected to drought-stressed conditions (soil moisture was gradually reduced to 25% of field capacity), while the other half remained well-watered (soil moisture maintained at 70% of field capacity). At harvest, Asif et al. collected a number of growth and yield parameter measurements and they also determined the grain Zn and protein concentrations for plants grown in each treatment. And what did their data reveal?
As shown in Figure 1 below, grain yield, number of spikes per plant and straw yield were all negatively impacted by drought and low Zn conditions. However, elevated CO2 improved the value of these three parameters in every instance and was even able to totally ameliorate the stresses of drought and low Zn (as evidenced from the figure below when comparing the growth values under elevated CO2 in the low Zn and drought-stressed chambers with those reported under ambient CO2, adequate Zn and well-watered conditions, which are not significantly different from one another). Thus, according to Asif et al., "wheat plants exposed to a combination of drought and low Zn supply benefited more from elevated CO2 in terms of grain yield and total biomass," which effect they say "can be generally attributed to an enhanced water and nutrient use efficiency at elevated CO2 conditions."
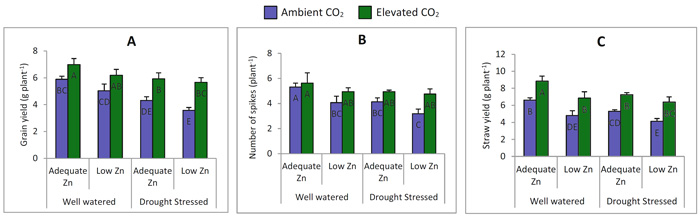
Figure 1. (A) Grain yield, (B) number of spikes per plant and (C) straw yield of adequate and low Zn treated wheat plants grown under well-watered and drought stressed conditions in ambient (blue bars) and elevated (green bars) atmospheric CO2 conditions. Bars represent mean values ± SD of parameters and values differing significantly at p < 0.05 are represented by different letters. Source: Asif et al. (2017).
With respect to their Zn and protein measurements, the three Turkish researchers report finding a slight decline in grain Zn and protein concentrations and content. However, they note that the "total grain Zn uptake was found to be almost unaffected by elevated CO2 within each Zn treatment." Similarly, they observed that "the yield increase caused by elevated CO2 restored the grain protein yield to the level of adequate Zn and well-watered conditions." Thus, on a whole-plant basis, Zn and protein concentrations (mg plant-1) remained the same, regardless of atmospheric CO2 concentration (see Figure 2, which reveals statistically similar values for Zn uptake and grain protein yield in each of the different treatments).
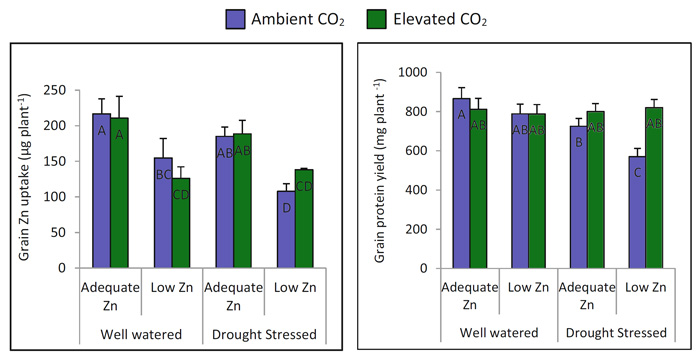
Figure 2. Grain Zn uptake (left panel) and grain protein yield (right panel) of adequate and low Zn treated wheat plants grown under well-watered and drought stressed conditions in ambient (blue bars) and elevated (green bars) atmospheric CO2 conditions. Bars represent mean values ± SD of parameters and values differing significantly at p < 0.05 are represented by different letters. Source: Asif et al. (2017).