


| Tweet | Follow @co2science |
Paper Reviewed
Lan, W.H., Kuo, C.Y., Kao, H.C., Lin, L.C., Shum, C.K., Tseng, K.H. and Chang, J.C. 2017. Impact of geophysical and datum corrections on absolute sea-level trends from tide gauges around Taiwan, 1993-2015. Water 9: 480, doi:10.3390/w9070480.
Periodically, individual scientists and groups of scientists analyze sea level data to see if there is any indication of a dramatic increase in the mean rate-of-rise of the ocean surface in response to the supposedly unprecedented warming of the planet over the past few decades, which latter phenomenon the world's climate alarmists claim should be accelerating sea level rise and leading to catastrophic coastal flooding throughout the world.
The latest research team to investigate sea level trends is that of Lan et al. (2017), who did so for Taiwan. Working with a set of 19 tide gauge stations, which the scientists carefully audited for errors, Lan et al. quantified long-term regional sea-level trends and the major factors impacting those trends, including ocean tides, vertical land motion, datum shifts and inverted barometer effects, over the period 1993-2015. They also examined the influence of the Pacific Decadal Oscillation (PDO) and the El Niño-Southern Oscillation (ENSO) -- two large-scale climate indices -- on those trends.
The researchers' results are presented in the figure below. After correcting for contaminating influences in the data, Lan et al. calculate a 2.19 mm/yr rise in regional sea level over the period of study, which trend, they say, is the same as that estimated using satellite altimetry methods for this region (2.2 mm/yr). Interestingly, the value of their calculated trend is lower than that reported for the globe as a whole (3.2 mm/yr from Cazenave and Lc Cozannet, 2014) and for that previously estimated for Taiwan (5.00 mm/yr from altimeter data for 1993-2007 by Tseng et al., 2010), which differences they say may have arisen from (1) a superior method in their filtering out contaminating influences from the sea level record and/or (2) differences in the length of time over which sea level trends were computed.
Looking to the future, Lan et al. depart from climate alarmist projections of alarming sea level rise, writing instead that the data "suggest that the regional sea-level trends around Taiwan in the next 10-30 years may be lower than the trends observed in the past 20 years" (emphasis added). Such reasoning is based on the relationship they uncovered between sea level and changes in ENSO and the PDO shown in Figure 1 below.
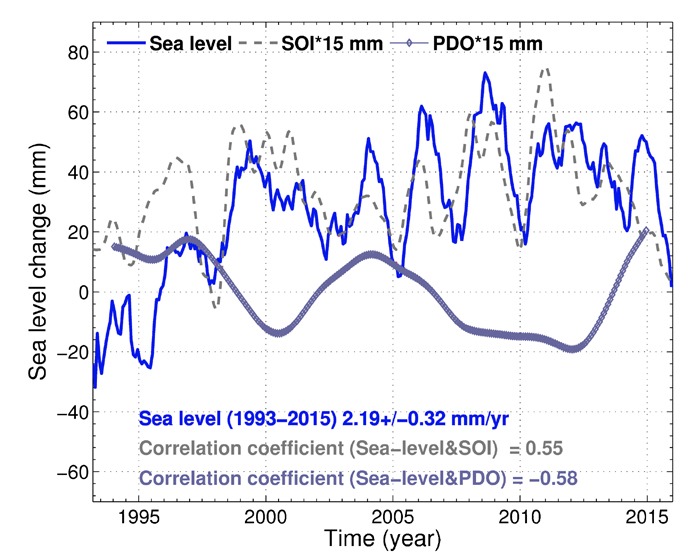
Figure 1. Taiwan sea level record derived from satellite altimetric data covering the period 1993 to 2015. The seasonal signals have been removed, and an 11-month smoothing applied to the altimetric data. The gray dashes and purple diamond curves denote the low-pass southern oscillation index (SOI) and Pacific decadal oscillation (PDO), respectively, using 11-month and five-year smoothing, respectively. Source: Lan et al. (2017).
References
Cazenave, A. and Le Cozannet, G. 2014. Sea-level rise and its coastal impacts. Earth's Future 2: 15-34.
Tseng, Y.H., Breaker, C.L. and Chang, T.Y. 2010. Sea-level variations in the regional seas around Taiwan. Journal of Oceanography 66: 27-39.
Posted 7 December 2017