


| Follow @co2science |
Paper Reviewed
Bi, Y., Xu, J., Yang, J., Li, Z., Gebrekirstos, A., Liang, E., Zhang, S., Yang, Y., Yang, Y. and Yang, X. 2017. Ring-widths of the above tree-line shrub Rhododendron reveal the change of minimum winter temperature over the past 211 years in Southwestern China. Climate Dynamics 48: 3919-3933.
Writing as background for their work, Bi et al. (2017) note that "understanding past variations in minimum winter temperature and their effects on the earth's ecosystems will be necessary for the accurate prediction of future changes and for the development of suitable responses and strategies for conservation in the context of climate change." However, modern instrumental temperature records typically do not exist beyond a few decades to a century, making it critical for scientists to develop longer-term proxy records from which to judge and develop such strategies.
As their contribution to the subject, Bi et al. analyzed the radial growth of Rhododendron alpine shrub species, ultimately producing a proxy of minimum winter temperature for southwestern China since the late 1600s. This reconstruction is shown in the figure below.
In discussing the record, Bi et al. note the presence of multidecadal fluctuations between warm and cold periods. And in this regard they report that power spectrum analysis revealed high frequency peaks ranging from 2.01 to 3.28 years, which they deduce are probably linked to "larger scale climate oscillations of the Western Pacific and North Indian Ocean, as well as the North Atlantic Oscillation." They also report the presence of two low frequency peaks at 94 and 141 years, although they offer no hypothesis as to their cause.
Perhaps the most interesting fact with respect to their temperature reconstruction is the warming trend of the past seven decades, which they say "is not the warmest period that has occurred" in the record. Indeed, as viewed by the dark and light red shading in the figure below, there were multiple periods in the record where temperatures were warmer than the present, indicating that "recent warming events are within the range of long-term temperature fluctuations." Thus, it would seem that in a location that is projected to show large-scale and rapid warming in response to increasing emissions of CO2 into the atmosphere, real-world data show that such a warming is just not happening.
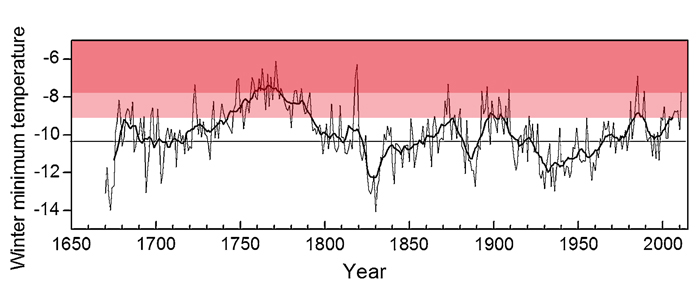
Figure 1. Reconstructed minimum winter temperature (°C) for southwest China. The thin and thick black lines represent the annual and 11-year smoothing average temperatures, respectively. Data that fall within the red shaded regions represent temperatures that were higher than that recorded at the end of the record for the 11-year smoothing average (both light and dark red shading) and annual (dark red shading only) data lines. Adapted from Bi et al. (2017).