


| Follow @co2science |
Paper Reviewed
Rangel-Buitrago, N.G., Thomas, T., Phillips, M.R., Anfuso, G. and Williams, A.T. 2016. Wave climate, storminess, and Northern Hemisphere teleconnection patterns influences: The Outer Bristol Channel, South Wales, U.K. Journal of Coastal Research 32: 1262-1276.
Rangel-Buitrago et al. (2016) begin their work by noting that "there is a growing globally acknowledged urgency to develop adaptation and mitigation measures to cope with future climate-change impacts on coastlines," especially in light of model-based projections of future storm events that are anticipated by climate alarmists to increase in both frequency and magnitude in response to CO2-induced global warming. However, as we have oft noted in an untold number of reviews posted on our CO2 Science website over the past two decades, model projections of extreme weather events generally do not support empirical observations. And the work of Rangel-Buitrago et al. is the latest in a long line of reviews that demonstrate this fact.
In regard to their analysis, the team of five researchers examined wave-buoy data recorded at Turbot Bank buoy near the western edge of the Bristol Channel, Wales, UK (51.6°N, 4.58°W), over the period 1998-2013. More specifically, they analyzed average annual and monthly significant wave (Hs) and maximum wave (Hsmax) heights to characterize trends in "wave climate, wave energy, and the definition and description of storms." And what did that investigation reveal?
Small decreases in monthly Hs and Hsmax values were observed over the length of the record as shown in the figure below. Similarly, there were nonsignificant decreasing trends in wave energy and the frequency, duration and intensity of storms throughout the record (also shown below). These findings, in the words of the authors, are "contradicting [of] the forecasted general increase, attributed to climatic change, in the number and intensity of storms in many oceans around the world and, more closely, in the northern hemisphere.
Indeed they are.
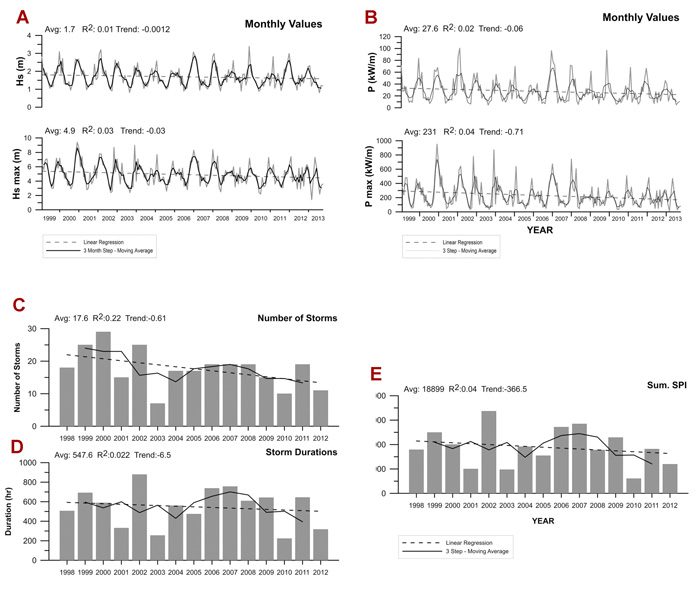
Figure 1. Panel A: Monthly average values of significant wave height (Hs) and maximum wave height (Hsmax). Panel B: Monthly average values of wave power and maximum wave power. Panels C, D and E: Distribution of the number of storms (C), duration (D), and sum of storm power (E) per year. Source: Rangel-Buitrago et al. (2016).