


| Follow @co2science |
Paper Reviewed
Köse, N., Güner, H.T., Harley, G.L. and Guiot, J. 2017. Spring temperature variability over Turkey since 1800 CE reconstructed from a broad network of tree-ring data. Climate of the Past 13: 1-15.
Introducing the topic of their work, Köse et al. (2017) state that "the meteorological observational period in Turkey, which starts ca. 1930 CE, is too short for understanding long-term climate variability." Therefore, the team of four scientists set out to produce a temperature reconstruction for the region that would "provide a more comprehensive understanding of climate conditions during the 19th and 20th centuries." And to accomplish this objective, they utilized a network of 23 tree-ring site chronologies across a study area spanning 36-42°N and 26-38°E from which they created a high-resolution spring (March-April) temperature reconstruction for the period 1800-2002.
So what did their proxy temperature record show?
As seen in the figure below, the Turkish reconstruction reveals there is nothing unusual, unnatural or unprecedented about temperatures in this region over the past two centuries, as there have been periods when temperatures have been both warmer and colder than they are currently. However, the authors do report that "the 19th century was characterized by more high-frequency fluctuations compared to the 20th century, which was defined by more gradual changes." Thus, temperatures in this region have become far more stable (less variable) in the past century (1900-2002) than they were in the century prior (1800-1900).
All things considered, therefore, it would appear that rising CO2 emissions have exerted no fingerprint of anthropogenic global warming here!
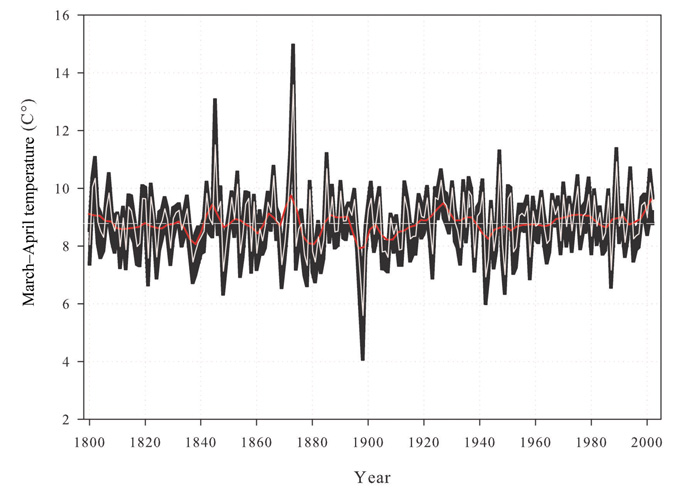
Figure 1. March-April temperature reconstruction for Turkey over the period 1800-2002. The horizontal, central white line shows the reconstructed long-term mean and does not include instrumental data; black background denotes Monte Carlo (n D1000) bootstrapped 95% confidence limits; and the red line shows 13-year low-pass filter values. Source: Köse et al. (2017).