| Follow @co2science |
Paper Reviewed
Gou, X., Gao, L., Deng, Y., Chen, F., Yang, M. and Still, C. 2015. An 850-year tree-ring-based reconstruction of drought history in the western Qilian Mountains of northwestern China. International Journal of Climatology 35: 3308-3319.
In explaining the rationale for their work, Gou et al. (2015) state that it is necessary to produce long-term drought reconstructions "for the purposes of accurately understanding current as well as predicting future hydroclimatic changes." This is because long-term records can provide historical context and shed critical light on important climate forcings, feedbacks and processes, as well as provide a means to test climate model projections that forecast changes due to anthropogenic increases in atmospheric CO2. Against this backdrop, and hoping to fill a regional data void, Gou et al. thus set out to reconstruct the hydroclimatic history of the western Qilian Mountains of northwestern China.
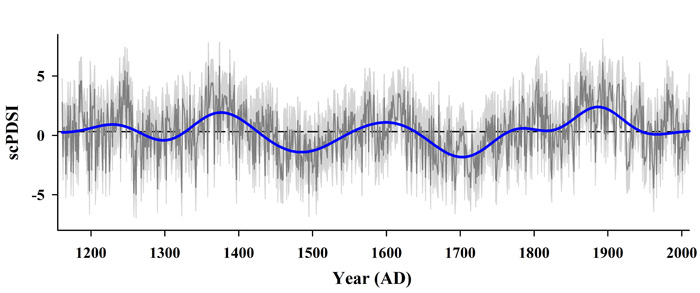
Their proxy record originated from juniper tree-ring cores, which after proper analysis and calibration, produced an 850-year (AD 1161-2010) reconstruction of drought (May-July self-calibrating Palmer Drought Severity Index). As shown in the figure below (and confirmed by spectral analysis), there are several interannual, inter-decadal and centennial cycles present in the record, but no trend in the data that would suggest an obvious recent influence from greenhouse gases. In contrast, however, the scientists report that three periods of mega-drought (AD 1260s-1340s, 1430s-1540s and 1640s-1740s) "corresponded to the Wolf, Spörer and Maunder solar activity minimum periods," while adding that "results of the multi-tape method analysis and wavelet analysis further confirmed the relationship between hydroclimate variability and solar activity forcing."

Figure 1. The reconstructed western Qilian scPDSI (dark grey thin line) series for the period AD 1161 to 2010 and the 100-year low-pass curve (blue bold line). The light grey area indicates the annual estimation errors (±1 standard error of the estimate from regression). Source: Gou et al. (2015).


