


| Follow @co2science |
Paper Reviewed
Carles, S., Groulx, D.B., Lamhamedi, M.S., Rainville, A., Beaulieu, J., Bernier, P., Bousquet, J., Deblois, J. and Margolis, H.A. 2015. Family variation in the morphology and physiology of white spruce (Picea glauca) seedlings in response to elevated CO2 and temperature. Journal of Sustainable Forestry 34: 169-198.
Carles et al. (2015) introduce their study of white spruce (Picea glauca) seedlings by noting that various tree improvement programs are striving to develop plant families that would be able to adapt to possible future growing conditions, focusing their attention in this regard on climate-alarmist concerns about predicted increases in atmospheric CO2 concentration and temperature. So in order to obtain further insight into the ability -- or not -- of white spruce trees to cope with these potential atmospheric conditions, they grew white spruce seedlings from 60 different full-sub families that they subjected to a combination of two temperature regimes (ambient and ambient plus 5°C) and two levels of atmospheric CO2 (380 and 760 ppm) over two growing seasons. And what did they thereby learn?
The nine Canadian scientists report that "warmer temperatures and CO2 elevation had a positive effect on the height and diameter growth of 2- and 3-year-old seedlings full-sib families." And they also report that instantaneous water use efficiency was "affected positively by the CO2 treatment, showing a 51% increase that was consistent across families" (see figure below). So as things stand currently, it would appear that white spruce trees in a CO2-enriched and warmer world would likely do much better than they do today.
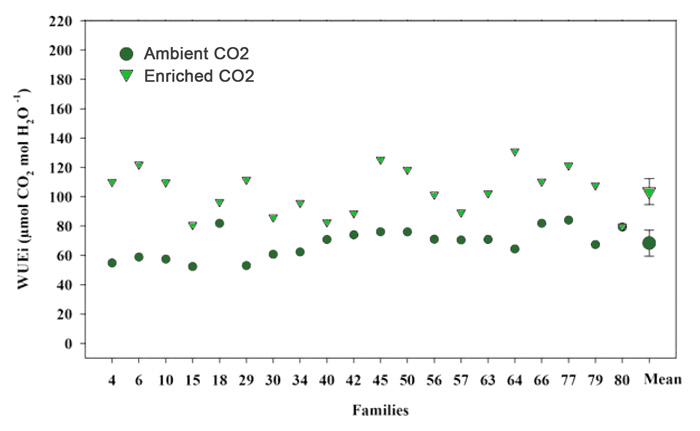
Family means (n = 4) for instantaneous water use efficiency (WUEi = A/gsw) of 3-year-old seedlings for 20 full-sib white spruce families subjected to two levels of CO2 concentrations (Ca = 380 ppm or Ce = 760 ppm) during their second and third growing seasons. Mean values per level of CO2, with their standard error are also reported on the right side for each variable with their standard error (n = 80). Source: Carles et al. 2015.