


| Tweet | Follow @co2science |
Paper Reviewed
Taricco, C., Alessio, S., Rubinetti, S., Zanchettin, D., Cosoli, S., Gacić, M., Mancuso, S. and Rubino, A. 2015. Marine sediments remotely unveil long-term climatic variability over Northern Italy. Scientific Reports 5: 12111, doi:10.1038/srep12111.
Introducing their work, Taricco et al. (2015) write that "a deep understanding of natural decadal variability is pivotal to discuss recently observed climate trends." Indeed, such comprehension is necessary before claims of an anthropogenic influence on climate-related parameters can be validated. And it is with this fact in mind that the eight Italian researchers determined to study the hydrologic variability of the Po River, a major freshwater river whose catchment encompasses a large area of Northern Italy. More specifically, they examined a high-resolution foraminiferal δ18O record from a sediment core retrieved from the Ionian Sea to reconstruct a 2,200-year history of hydrological variability. And what did the reconstruction show?
In discussing their findings, Taricco et al. report that spectral analysis of the core "reveals a highly significant decadal cycle with modulated amplitude throughout the whole 2,200-yr-long δ18O record" (see figure below). During some periods, the amplitude of the decadal fluctuations was found to be exceptionally high, including the periods AD 300-600, 900-1100 and 1400-1800, the latter of which witnessed the highest level of hydrologic variability and coincided with "the coldest phase of the Little Ice Age." In contrast, the reconstructed amplitude was found to be weakest around AD 200, 800, 1200 and 1400. These findings were bolstered by a comparison between Taricco's reconstructed amplitude and archived reports of floods in the Po River basin over the past two millennia, which revealed widespread coherence among the two records.
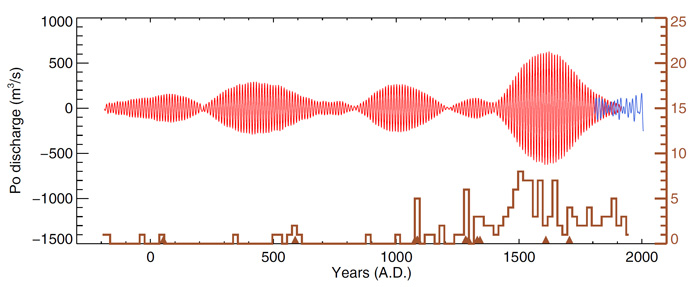
Figure 1. Extrapolation of the Po River discharge before 1917 to the last 2 millennia (red curve). As a reference for the modern era, the Po discharge decadal component is superimposed (blue curve). Known major floods in the Po plain from 200 BC are represented by the histogram, with major events demarked by brown triangles along the edge of the x-axis. The same weight is attributed to each flooding event, since documental description is only qualitative. Adapted from Taricco et al. (2015).
Given the above findings, it would appear that the modern rise in atmospheric CO2 has had no measureable impact on the hydrologic variability of Northern Italy. Rather, such trends have waxed and waned naturally for two millennia or more and will likely continue to do so in the future, changes in atmospheric CO2 concentrations notwithstanding.
Posted 11 April 2016