| Tweet | Follow @co2science |
Paper Reviewed
Steinkamp, J. and Hickler, T. 2015. Is drought-induced forest dieback globally increasing? Journal of Ecology 103: 31-43.
In light of the global warming that ceased nearly two decades ago, droughts have been predicted -- and are still periodically projected -- to become more severe and widespread in future decades, leading to the dieback of many of the world's forests. A new study, however, suggests these projections have little solid support in terms of real-world data.
In a Special Feature of the Journal of Ecology, Steinkamp and Hickler (2015) describe how they "analyzed historical climate data from two climate data sets and used a dynamic global vegetation model (LPJ-GUESS) "to assess (i) which forests globally might have been affected by drought, (ii) if the field observations are representative of all forests, and (iii) if the model can reproduce the reported mortality events."
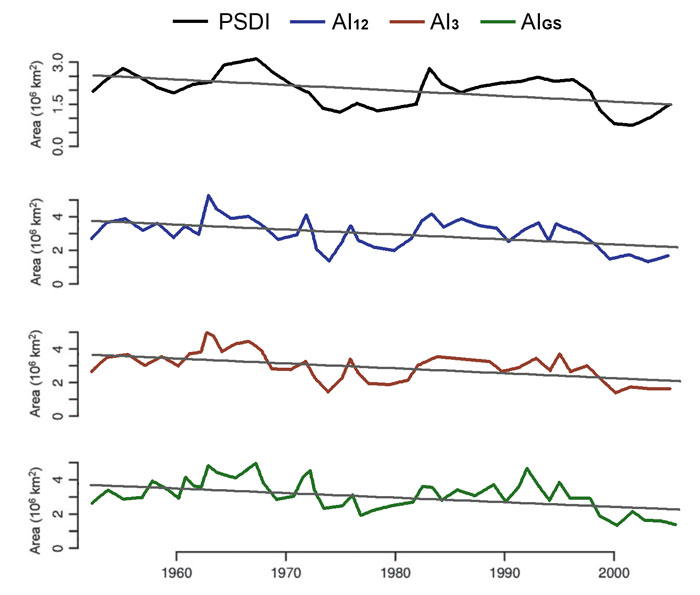
In discussing their findings, Steinkamp and Hickler report "we could not identify a general drying trend or an increase in extreme drought events in forests globally." In looking at their Figure 4, reproduced below, it is clear that not only are extreme drought events not increasing, they are decreasing at a high and statistically significant rate! In addition, the German researchers state that "the poor correspondence between the simulated and reported mortality events indicates that models like LPJ-GUESS driven by standard climatologies and soil input data do not represent drought-induced mortality well," which leads them to ultimately suggest that "drought stress might not be the main driver of all the reported drought-mortality events." And so it is that in answer to the question that serves as the title of Steinkamp and Hickler's paper -- Is drought-induced forest dieback globally increasing? -- one must rationally conclude on the whole that it likely is not.

Total forest area affected by drought over the period 1948-2006 as defined by four measures of drought, including the PDSI (black line), AI12 (blue line), AI3 (red line), and AIGS (green line). PSDI = Palmer Drought Severity Index and AI = Aridity Index. The Aridity Index indicies used here provide a ratio of precipitation to potential evapotranspiration for the entire year (AI12), the three warmest months of the year (AI3), and the length of the growing season when mean monthly temperatures were greater than 5 °C (AIGS).


