


| Tweet | Follow @co2science |
Paper Reviewed
Yan, H., Soon, W. and Wang, Y. 2015. A composite sea surface temperature record of the northern South China Sea for the past 2500 years: A unique look into seasonality and seasonal climate changes during warm and cold periods. Earth-Science Reviews 141: 122-136.
Introducing their work, Yan et al. (2015) note several high-resolution climate reconstructions of the late Holocene provide an opportunity to place current global warming in a long-term context; and they thus proceed to describe the results of their contribution to this important effort, which was to combine seven high-resolution, seasonally-resolved, coral and Tridacna gigas (the largest bivalve species in the global ocean) proxy-SST records together with the instrumental SST record from the 1990 to 2000 interval to provide a 2500-year history of the climatic variations in the northern SCS over the late Holocene.
This work revealed the occurrence of two warm periods, one centered on approximately AD 990 corresponding to the Medieval Warm Period (MWP) and one centered on approximately AD 50 corresponding to the Roman Warm Period (RWP), while it also revealed the occurrence of two cold periods: the Dark Ages Cold Period (DACP) between the Roman and Medieval Warm Periods and the Little Ice Age (LIA) between the Medieval and Current Warm Periods (see figure below).
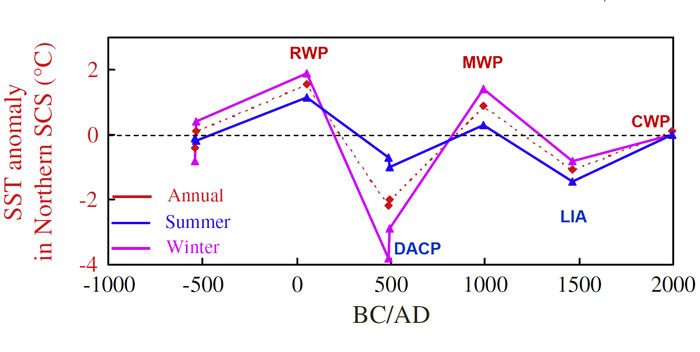
The composite proxy-SST records. Winter (triangles connected by pink curve), summer (triangles connected by blue curve) and annual-mean (diamonds connected by red curve) proxy SSTs in the northern South China Sea over the past 2500 years. Adapted from Yan et al. (2015).
As for the relative temperatures of these different intervals, the three researchers report that "the annual-mean proxy-SST for the time window during the RWP is the warmest one among the eight time windows of our northern SCS composite record," it having been 1.55°C warmer than "recent decades," which result, in their words, "is consistent with the nearby SST reconstruction surrounding the marine-continental region of Indonesia (Oppo et al., 2009) and in China (Yang et al., 2002)," which they say matches "especially well with the Northern Hemisphere-wide composites by Moberg et al. (2005) and Ljungqvist (2010)." And in viewing the figure above, it can be seen that the MWP was also warmer than the CWP by approximately 1.0°C.
And because these warmer-than-present periods occurred when the atmosphere's CO2 concentration was only about 70% of what it is today, it is likely that the atmosphere's CO2 content has had little to do with the development of the recent warmth of the modern era.
References
Ljungqvist, F.C. 2010. A new reconstruction of temperature variability in the extra-tropical Northern Hemisphere during the last two millennia. Geografiska Annaler Series A Physical Geography 92: 339-351.
Moberg, A., Sonechkin, D., Holmgren, K., Datsenko, N. and Karlen, W. 2005. Highly variable Northern Hemisphere temperatures reconstructed from low- and high-resolution proxy data. Nature 433: 613-617.
Oppo, D.W., Rosenthal, Y. and Linsley, B.K. 2009. 2,000-year-long temperature and hydrology reconstructions from the Indo-Pacific warm Pool. Nature 460: 1113-1116.
Yang, B., Braeuning, A., Johnson, K.R. and Yafeng, S. 2002. General characteristics of temperature variation in China during the last two millennia. Geophysical Research Letters 29: 10.1029/2001GL014485.
Posted 13 June 2015