


| Tweet | Follow @co2science |
Paper Reviewed
Piao, S, Yin, G., Tan, J., Cheng, L., Huang, M., Li, Y., Liu, R., Mao, J., Myneni, R.B., Peng, S., Poulter, B., Shi, X., Xiao, Z., Zeng, N., Zeng, Z. and Wang, Y. 2015. Detection and attribution of vegetation greening trend in China over the last 30 years. Global Change Biology 21: 1601-1609.
According to Piao et al. (2015), the reliable detection and attribution of changes in vegetation growth are essential prerequisites for "the development of successful strategies for the sustainable management of ecosystems." And indeed they are, especially in today's world in which so many scientists and policy makers are concerned with what to do (or not do) about the potential impacts of CO2-induced climate change. However, detecting vegetative change, let alone determining its cause, can be an extraordinarily difficult task to accomplish. Nevertheless, that is exactly what Piao et al. set out to do in their recent study.
More specifically, the team of sixteen Chinese, Australian and American researchers set out to investigate trends in vegetational change across China over the past three decades (1982-2009), quantifying the contributions from different factors including (1) climate change, (2) rising atmospheric CO2 concentrations, (3) nitrogen deposition and (4) afforestation. To do so, they used three different satellite-derived Leaf Area Index (LAI) datasets (GLOBMAP, GLASS, and GIMMIS) to detect spatial and temporal changes in vegetation during the growing season (GS, defined as April to October), and five process-based ecosystem models (CABLE, CLM4, ORCHIDEE, LPJ and VEGAS) to determine the attribution.
With respect to detection, this work revealed that most regions of China experienced a greening trend indicative of enhanced growth across the time period studied (see Figure 1). Overall, 56 percent of the area studied experienced a significant increase in greening (95% level) when using the GLOBMAP dataset, compared with 54 and 31 percent using the GLASS and GIMMIS datasets. Those regions with the largest greening trends include southwest China and part of the North China Plain.
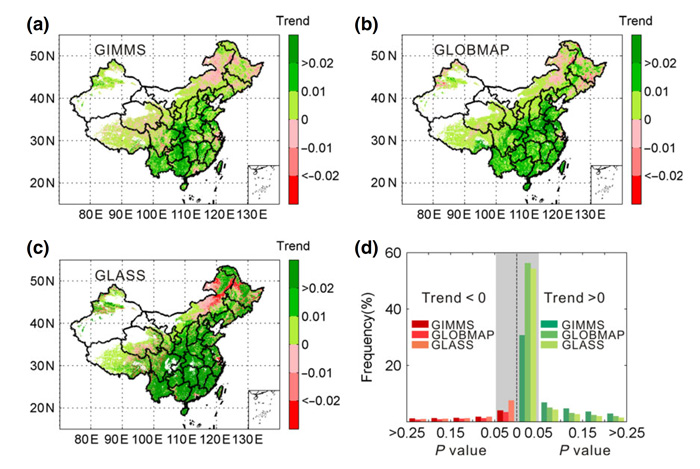
Figure 1. Spatial distribution of the trend in LAIGS over the period 1982-2009 as calculated by the GIMMS dataset (a), GLOBMAP dataset (b) and the GLASS dataset (c). The frequency distribution of the significance level (P value) of the trends calculated for the three LAIGS datasets is shown in panel d.
With respect to attribution, Piao et al. report that "the combined effect of CO2 fertilization and climate change with the effect of nitrogen deposition, leads to the conclusion that these three factors are responsible for almost all of the average increasing trend of LAIGS observed from the satellites" (see Figure 2). They also report that "at the country scale, the average trend of LAIGS attributed to rising CO2 concentration is estimated to be ... about 85% of the average LAIGS trend estimated by satellite datasets," while noting secondarily that the enhanced nitrogen deposition driven by fossil fuel combustion and agricultural fertilization is likely the source of the remaining portion of China's enhanced vegetation growth, citing the findings of Reay et al. (2008), Thomas et al. (2009), Fleischer et al. (2013) and Yu et al. (2014).
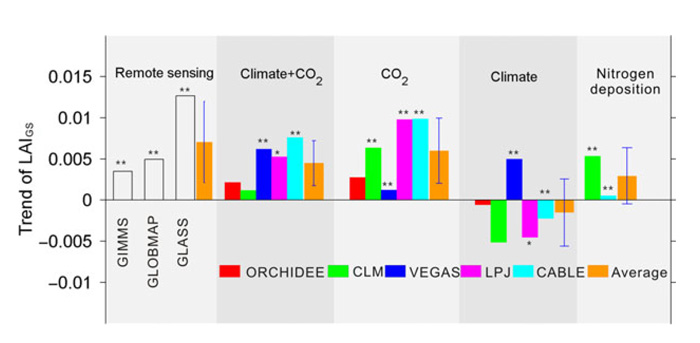
Figure 2. Trend in China's LAIGS over the period 1982-2009 at the country scale for the three satellite remote sensing datasets and five process models described in the text above. Significance levels of 95 and 99 percent are denoted with one and two asterisks, respectively. See the authors' original text (Piao et al., 2015) for additional explanation of this figure.
In considering the researchers' several findings, it is clear that the fossil fuel combustion that has resulted in the rise in atmospheric CO2 and enhanced nitrogen deposition over the past three decades has provided a great benefit to Chinese vegetation. And as illustrated in Figure 2, led primarily by the increase in CO2, that benefit has been more than sufficient to compensate for the negative effects of climate change that also occurred over that time period. Thus, it would seem far more prudent to celebrate CO2 instead of demonizing it, like so many people incorrectly do these days; for atmospheric CO2 is truly the elixir of life!
References
Fleischer, K., Rebel, K.T., Molen, M.K., Erisman, J.W., Wassen, M.J., van Loon, E.E., Montagnani, L., Gough, C.M., Herbst, M., Janssens, I.A., Gianelle, D. and Dolman, A.J. 2013. The contribution of nitrogen deposition to the photosynthetic capacity of forests. Global Biogeochemical Cycles 27: 187-199.
Reay, D.S., Dentener, F., Smith, P., Grace, J. and Feely, R.A. 2008. Global nitrogen deposition and carbon sinks. Nature Geoscience 1: 430-437.
Thomas, R.Q., Canham, C.D., Weathers, K.C. and Goodale, C.L. 2009. Increased tree carbon storage in response to nitrogen deposition in the U.S. Nature Geoscience 3: 13-17.
Yu, G., Chen, Z., Piao, S., Peng, C., Ciais, P., Wang, Q., Li, X., and Zhu, X. 2014. High carbon dioxide uptake by subtropical forest ecosystems in the East Asian monsoon region. Proceedings of the National Academy of Sciences USA 111: 4910-4915.
Posted 22 July 2015