


| Tweet | Follow @co2science |
Paper Reviewed
Krusic, P.J., Cook, E.R., Dukpa, D., Putnam, A.E., Rupper, S. and Schaefer, J. 2015. Six hundred thirty-eight years of summer temperature variability over the Bhutanese Himalaya. Geophysical Research Letters 42: 2988-2994.
Noting that "high-resolution tree ring reconstructions from the Himalaya provide essential context for assessing impacts of future climate change on regional water reserves and downstream agriculture," Krusic et al. (2015) worked with a small network of tree-ring chronologies from Bhutan to develop a 638-year summer temperature history of the period stretching from 1376 to 2013 of the Common Era (C.E.).
This work revealed, in the words of the six scientists, that "relative to the 1950-2013 C.E. average summer temperature, three prominent cold periods stand out, two in the mid-fifteenth century, and one in the late seventeenth century." And they say that these "anomalously cold periods appear to align with solar irradiance minima in the fifteenth, late seventeenth, and early nineteenth centuries, implying a link between solar variability and decadal-scale temperature variability."
At the other end of the temperature spectrum, they report that "the warmest period occurs within the most recent decade, 2004-2013 C.E." But, most interestingly, they say that "this period is not statistically unprecedented compared with earlier warm periods, e.g., in the 1650s and late fourteenth century" (see figure below), during which time intervals there was way less CO2 in Earth's atmosphere (~280 ppm) than there is today (~400 ppm).
Taken together, the two sets of findings reported above suggest that real-world variations in solar radiation reception at the Earth's surface clearly have strong impacts on the planet's surface air temperature, but that even greater variations in the Earth's atmospheric CO2 concentration do not.
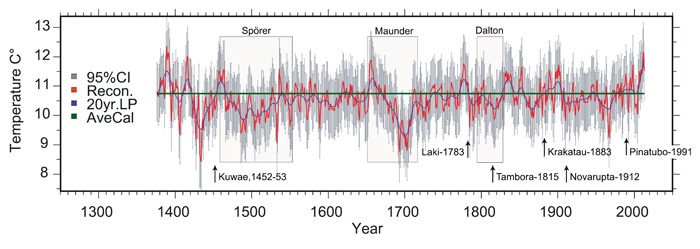
June-August temperature reconstruction for Dhur-Ura, Bhutan, shown with a 20 year low-pass filter and 95% prediction intervals, along with the calibration period mean. Overlayed on the reconstruction are the relative time spans of the Spörer, Maunder, and Dalton solar minimums, and the years of six volcanic eruptions mentioned in the text. Source: Krusic et al. (2015).