Volume 16, Number 20: 15 May 2013
In a revealing study published in Quaternary Science Reviews, Axford et al. (2013) describe how they examined sedimentary records from five lakes (North, Fishtote, Loon, Iceboom and Pluto) near Jakobshavn Isbrae in central West Greenland, in order to investigate the timing and magnitude of major Holocene climate changes, with their primary objective being "to constrain the timing and magnitude of maximum warmth during the early to middle Holocene positive anomaly in summer insolation," which they did by analyzing various properties of sediment cores they extracted from the lakes in the summers of 2008 and 2009.
So what did they find? "Based upon chironomid assemblages at North Lake, and supported by records of organic sedimentation in all five study lakes," in the words of the six scientists, "we infer warmer-than-present temperatures by at least 7.1 ka [thousands of years before present] and Holocene maximum warmth between 6 and 4 ka," when they indicate that "the local ice sheet margin was at its most retracted Holocene position" and "summer temperatures were 2-3°C warmer than present during that time of minimum ice sheet extent."
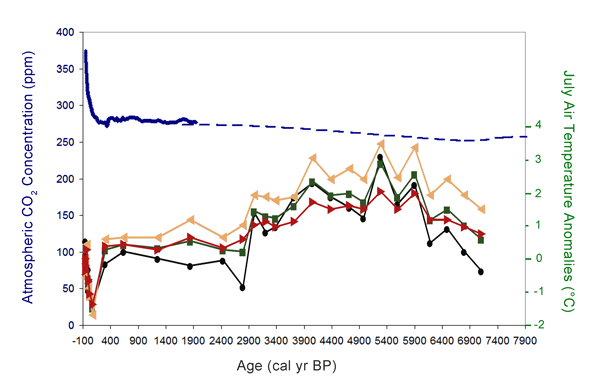
A graphical representation of this temperature history is presented in the figure below, along with the concomitant history of earth's atmospheric CO2 concentration.

Figure 1. Reconstructed July air temperature anomalies in the vicinity of North Lake, inferred from chironomid data using three different calibration formulas (1. Weighted-averaging, orange line with triangle data points, 2. Weighted-averaging with tolerance downweighting, red line with triangle data points, 3. Weighted-averaging partial-least-squares, black line with circle data points), plus the mean of the three sets of results (green line, square data points), as adapted from Axford et al. (2013). Also shown is the concomitant history of earth's atmospheric CO2 concentration, as obtained from atmospheric measurements carried out at Mauna Loa, Hawaii (Boden et al., 1994), together with ice core data obtained at Law Dome (Etheridge et al., 1998) and Vostock (Keeling and Whorf, 1998), Antarctica.
As can be seen from the figure above, there is absolutely no rational relationship between the Holocene temperature history derived by Axford et al. and the air's CO2 content. Over the first 1800 years of the record, for example, when the atmosphere's CO2 concentration rose by a sluggardly 10 ppm, Holocene temperatures rose, in the mean, by about 2.3°C. Then, over the following 2,400 years, when the air's CO2 content rose by about 20 ppm, mean summer air temperatures dropped by approximately 2.6°C. And over the next 1900 years, when the air's CO2 content rose by some 10 to 15 ppm, mean air temperature changed not at all. But over the final 300 or so years, when the atmospheric CO2 concentration rose by a whopping 125 ppm, summer air temperatures first declined by about 1.9°C and then rose by about 1.9°C, for essentially no net change. Clearly, the CO2 concentration of earth's atmosphere would appear to have had no consistent impact on July air temperatures in the vicinity of North Lake, Greenland, over the past seven millennia.
Sherwood, Keith and Craig Idso
References
Axford, Y., Losee, S., Briner, J.P., Francis, D.R., Langdon, P.G. and Walker, I.R. 2013. Holocene temperature history at the western Greenland Ice Sheet margin reconstructed from lake sediments. Quaternary Science Reviews 59: 87-100.
Boden, T.A., Kaiser, D.P., Sepanski, R.J. and Stoss, F.W. (Eds.). 1994. Trends '93: A Compendium of Data on Global Change. ORNL/CDIAC-65. Carbon Dioxide Information Analysis Center, Oak Ridge National Laboratory, Oak Ridge, Tennessee.
Etheridge, D.M., Steele, L.P., Langenfelds, R.L, Francey, R.J., Barnola, J.-M. and Morgan, V.I. 1998. Historical CO2 records from the Law Dome DE08, DE08-2, and DSS ice cores. In Trends: A Compendium of Data on Global Change. Carbon Dioxide Information Analysis Center, Oak Ridge National Laboratory, Oak Ridge, Tenn., U.S.A.
Keeling, C.D. and Whorf, T.P. 1998. Atmospheric CO2 concentrations -- Mauna Loa Observatory, Hawaii, 1958-1997 (revised August 1998). NDP-001. Carbon Dioxide Information Analysis Center, Oak Ridge National Laboratory, Oak Ridge, Tennessee.


