Reference
Box, J.E., Yang, L., Bromwich, D.H. and Bai, L.-S. 2009. Greenland ice sheet surface air temperature variability: 1840-2007. Journal of Climate 22: 4029-4049.
What was done
"Using a set of 12 coastal and 40 inland ice surface air temperature records in combination with climate model output," the authors say they reconstructed "long-term (1840-2007) monthly, seasonal, and annual spatial patterns of temperature variability over a continuous grid covering Greenland and the inland ice sheet," after which they say they compared "the 1919-32 and 1994-2007 warming episodes" and made "a comparison of Greenland ice sheet surface air temperature temporal variability with that of the Northern Hemisphere average."
What was learned
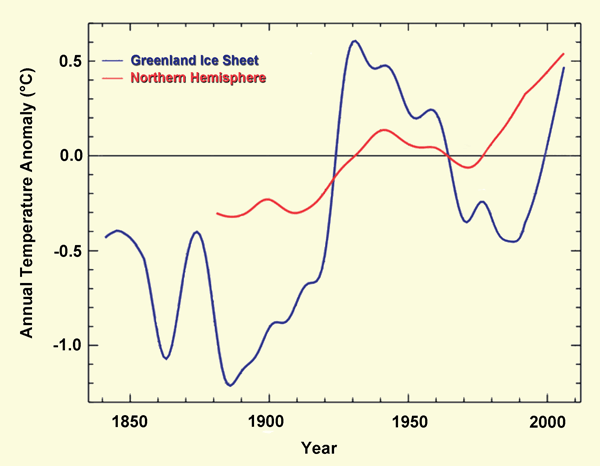
The near-surface air temperature history that Box et al. derived for Greenland is reproduced in the figure below, along with the corresponding history of Northern Hemispheric near-surface air temperature.

Figure 1. Low-pass-filtered Greenland and Northern Hemispheric near-surface air temperature anomalies with respect to the 1951-1980 base period vs. time. Adapted from Box et al. (2009).
Based on the results depicted in the figure above, the four researchers determined that "the annual whole ice sheet 1919-32 warming trend is 33% greater in magnitude than the 1994-2007 warming," and that "in contrast to the 1920s warming, the 1994-2007 warming has not surpassed the Northern Hemisphere anomaly." Indeed, they note that "an additional 1.0°-1.5°C of annual mean warming would be needed for Greenland to be in phase with the Northern Hemisphere pattern."
What it means
In spite of all the fuss climate alarmists make about Greenland being on the verge of crossing a tipping point and beginning to experience dramatic ice loss, the results of Box et al. demonstrate there is nothing unusual, unnatural or unprecedented about the nature of its 1994-2007 warming episode. In fact, it is much less impressive than the 1919-1932 warming; and it becomes even more "less impressive" when it is realized that the atmosphere's CO2 concentration only rose by about 5 ppm during the earlier period of stronger warming but by fully 25 ppm (five times more) during the later period of weaker warming.


