Reference
Kim, D.-W., Byun, H.-R. and Choi, K.-S. 2009. Evaluation, modification, and application of the Effective Drought Index to 200-Year drought climatology of Seoul, Korea. Journal of Hydrology 378: 1-12.
Background
Climate alarmists typically contend that in response to global warming, both droughts and floods become more frequent and severe. Hence, it is important to determine if long-term precipitation data from various places throughout the world provide any evidence for this phenomenon, which one would certainly think would be evident -- if the climate-alarmist contention was true -- over the period of time when the planet transited from the coldest interval of the current interglacial period (the Little Ice Age) to the end of the 20th century, by which time they claim the earth had warmed at a rate and to a level that was unprecedented over the past one to two millennia.
What was done
The authors developed a 200-year history of precipitation measured at Seoul, Korea (1807 to 2006), along with the results of a number of "progressive methods for assessing drought severity from diverse points of view," starting with (1) the Effective Drought Index (EDI) developed by Byun and Wilhite (1999), which Kim et al. describe as "an intensive measure that considers daily water accumulation with a weighting function for time passage," (2) a Corrected EDI that "considers the rapid runoff of water resources after heavy rainfall" (CEDI), (3) an Accumulated EDI that "considers the drought severity and duration of individual drought events" (AEDI), and (4) a Year-accumulated negative EDI "representing annual drought severity" (YAEDI).
What was learned
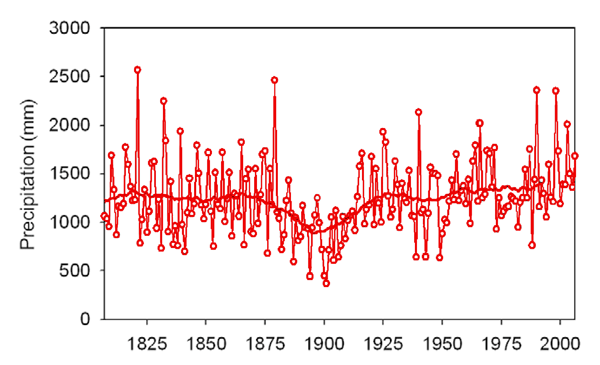
The researchers' precipitation history and two of their drought severity histories are presented, in that order, in the figures below.

Figure 1. Annual precipitation history at Seoul, Korea, where the solid line represents a 30-year moving-average. Adapted from Kim et al. (2009).

Figure 2. Annual "dryness" history at Seoul, Korea, represented by YAEDI365 (Sum of daily negative EDI values divided by 365, represented by bars) and YAEDIND (Sum of daily negative EDI values divided by total days of negative EDI, represented by open circles). Adapted from Kim et al. (2009).
What it means
In viewing the results depicted above, it is obvious that the only major multi-year deviation from long-term normalcy is the decadal-scale decrease in precipitation and ensuing drought, which phenomena each achieved their most extreme values (low in the case of precipitation, high in the case of drought) in the vicinity of AD 1900. Hence, it would appear -- in fact, it is very clear -- that the significant post-Little Ice Age warming of the planet had essentially no effect at all on the long-term histories of either precipitation or drought at Seoul, Korea, which observation adds to the growing body of such findings from all around the world, as may be seen from perusing the materials we have archived under the headings of Weather Extremes (Drought and Precipitation) in our Subject Index.
Reference
Byun, H.R. and Wilhite, D.A. 1999. Objective quantification of drought severity and duration. Journal of Climate 12: 2747-2756.


