


Results
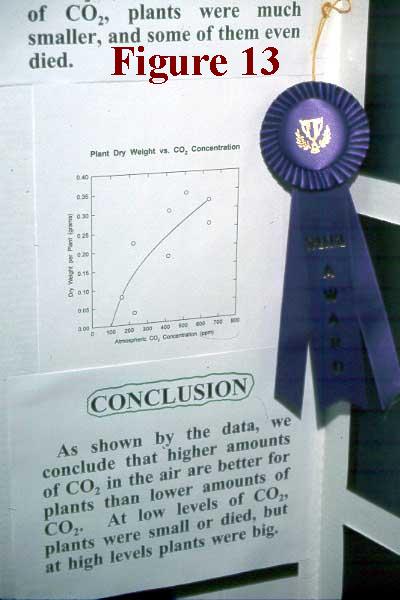 At the conclusion of our study, we prepared a graph of our results for the Salt River Pima-Maricopa Indian Community Science Fair. Our project won a "best of fair" ribbon, which is shown in Figure 13 attached to our display near the Conclusion section that follows the graph of our results.
 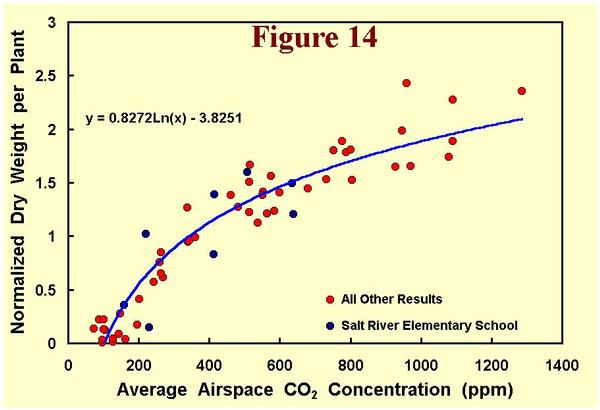 As can be seen from this graph, there was a large amount of scatter in our data. However, as can be seen from Figure 14, our results were totally compatible with the large population of data derived from a number of other Pothos experiments, including Center Experiments #1 and #2.
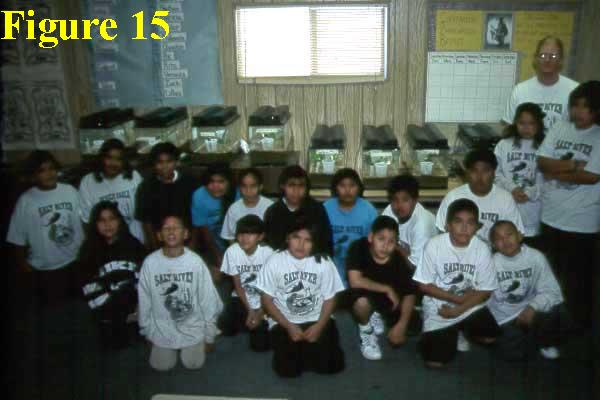 When all was said and done, the experiment proved successful. The students (see Figure 15) obtained hands-on experience in a key aspect of the scientific method. They learned the importance of continuous (in this case thrice-weekly) measurements of experimental variables. They could see with their own eyes how the plants developed each week and how they differed between the lowest and highest CO2 concentrations. They also learned that real experiments, especially biological experiments, often do not provide perfect results, and that one must sometimes replicate a study several times to be confident of one's findings. Last of all, they gained new insights into a perplexing real-world dilemma of global proportions that they will likely read about and hear discussed on radio and television for years to come.