


Introduction
Calibrating the Test Kit
Concepts
Theoretical Examples
Real-World Example
Simple Graphical Approach
Introduction
The CO2 measurement technique we employ makes use of the colorometric CO2 test kit produced and distributed by the Tetra Werke company of Melle, Germany. This kit was originally developed for measuring the amount of dissolved CO2 in freshwater aquariums; because, as stated on the back of each box in which the kits are packaged, even in aquariums, "carbon dioxide is the most important nutrient for healthy plant growth!"
The instructions that come with the CO2 test kit presuppose that it will be used in studies of aquatic plants, which we will, in fact, sometimes do. In most of our experiments, however, we will be studying terrestrial plants. Hence, there are a number of modifications and additions that must be made to the instructions that come with the kit, which we describe in the other sub-divisions of this CO2 Measurement Technique section.
Providing a Water Supply
In all types of biospheres, we need a source of water to test. In aquatic microcosms we have one ready-made; but in a terrestrial environment we need to provide our own, in order to develop a relationship between the CO2 concentration of the air enclosed within the biosphere and the concentration of CO2 dissolved in whatever body of water we place within it. Since this relationship will only be well-defined if the CO2 in the water is in equilibrium with the CO2 in the air, however, this requirement imposes certain restrictions upon us.
To begin, we are somewhat limited in the space that can be allotted for this purpose. It would be good to have a wide but shallow body of water within a terrestrial biosphere, to allow the greatest possible surface area of the water to come in contact with the biosphere's internal atmosphere; but we generally need that space for our experimental plants. Hence, we are forced to use glasses or water bottles that have much smaller ratios of exposed surface area to total water volume, making it more difficult (and making it take longer) for the CO2 concentrations of the two reservoirs (the water container and the biosphere's internal air space) to come into equilibrium with each other.
One way to minimize this problem is to not make CO2 measurements every single day. This provides more time for the CO2 dissolved in the water that must be added to replace the water that is removed for testing to come into equilibrium with the CO2 of the water that remains in the biospheric water container and the CO2 of the biosphere's internal atmosphere. Indeed, we find that three measurements per week (every Monday, Wednesday and Friday) are all that are really needed.
Second, since it is necessary to replace the water that is removed for testing, and since the adding of new water perturbs the CO2 content of the water in the glass or plastic reservoir in the experimental terrarium, we use two water reservoirs per biospheric enclosure. This way, if we siphon enough water out of the first reservoir for a CO2 test on a Monday and immediately refill it, and if we do the same with the second reservoir on Wednesday, four whole days will have elapsed before we return to take water out of the first reservoir on Friday, while five days will pass before we again take water out of the second reservoir on the following Monday. Furthermore, if the reservoirs are fairly deep, so we only use a small portion of the water they hold at each test, perturbations due to replacing water utilized in the CO2 testing procedure will be kept to a minimum.
Calibrating the test kit
Concepts
How do we develop a relationship between the CO2 concentration of the air inside a poor man's biosphere and the concentration of CO2 dissolved in the water maintained in the two glasses or bottles contained within it? Fortunately, this job has already been done and is described in detail by S.B. Idso in his Environmental and Experimental Botany article (Vol. 38, p. 15-38), where he shows that the CO2 concentration of the air in a poor man's terrestrial biosphere is a linear function of the number of solution number two drops required to turn 40 ml of test water treated with five drops of regent number one the shade of pink depicted on the back of the Tetra Werke CO2 test kit box. Specifically, by making thousands of measurements under a variety of different conditions, he found that, in the mean, Y = -222 + 385X2, where Y is the CO2 concentration, in units of parts per million (ppm), of the biosphere's internal atmosphere, and X2 is the number of solution number two drops that turns the water in the test vial the proper shade of pink after it has previously had five drops of reagent number one added to it.
In recently revisiting this calibration procedure, however, we have found that the first term on the right-hand side of this equation is significantly different from what Dr. Idso derived, although the slope of the relationship is identical. Whether this change is due to some change in the composition of the test kit's two reagents over the past two years, or some change in the chemistry of the local water supply, is currently unknown; but it clearly requires that we must have a way of accounting for still further differences of this nature that may occur at future dates or in other places.
Fortunately, as noted, the slope of the calibration relationship appears to be invariant. Hence, we can determine the equation that describes the calibration relationship in any situation by merely identifying the X2 , Y coordinates of any single point that falls on the calibration line. This can be done by determining the number of solution number two drops required to turn a water sample -- which has come to equilibrium with air of known CO2 concentration, and which has been treated with five drops of reagent number one -- the proper shade of pink; and for this purpose we suggest that the outside air of the free atmosphere serve as the CO2 source of approximately known concentration.
Over the globe as a whole, for example, the CO2 content of the atmosphere averages just under 370 ppm. In sizeable cities, however, we have recently shown that it may be considerably higher, especially at night (Idso et al., 1998, Physical Geography, in press). Nevertheless, our experiments within the metropolitan area of Phoenix, Arizona, have revealed that the outside air in most residential areas fluctuates right around 390 ppm throughout the greater portion of the daylight hours, so that if you expose a glass of water to the outside air for a few days, you can assume that the CO2 dissolved therein is in equilibrium with air of approximately 390 ppm CO2 and not be far off the mark.
Theoretical Examples
Let us say, for illustrative purposes only, that you expose two glasses of water to the air outside your home or school for a few days and you find, in the mean, that when a 40-ml water sample containing five drops of reagent number one has one drop of solution number two added to it, the water turns the shade of pink indicated on the back of the CO2 test kit box. The equation that must be satisfied in this situation is Y = B + 385X2; and for X2 = 1 when Y = 390 ppm, you can readily solve this equation and determine the value of B to be 5. Thereafter, then, you can calculate biospheric airspace CO2 concentrations via the equation Y = 5 + 385X2.
There is a slight possibility, however, that water that has been exposed to the outside air may turn the proper shade of pink before all five drops of reagent number one are added to it. For this situation you need a second calibration equation, which we have determined by our own extensive experimentation to be of the form Y = AX1, where X1 is the number of drops of reagent number one required to turn the water sample the proper shade of pink. Consequently, for illustrative purposes only, if a water sample in equilibrium with air having a CO2 concentration (Y) of 390 ppm turns the proper shade of pink when 4 drops (X1) of reagent number one are added to it, this second equation can be solved to yield A = 97.5, so that your calibration equation is this situation becomes Y = 97.5X1.
In either of these two situations, however, if a large range of atmospheric CO2 concentrations are to be measured, a separate equation for each of these two test solution regimes [low CO2 (1) and high CO2 (2)] will be required. Let us say, for example, and again for illustrative purposes only, that the water you expose to the outside air requires five drops of reagent number one and one drop of solution number two to turn it the proper shade of pink. As we have already seen, the calibration equation for this situation is Y = 5 + 385X2. Consequently, if we solve this equation for the value of Y that prevails when X2 is exactly equal to zero (which is the same situation as having X1 = 5), we get Y = 5 ppm; and since Y = AX1 whenever solution number two is not needed, setting Y = 5 ppm when X1 = 5 yields a value of 1 for A, so that the calibration equation for the low CO2 regime in this situation becomes merely Y = X1.
If, on the other hand, the water you expose to the outside air turns the proper shade of pink when 4 drops of reagent number one are added to it, we have previously shown that the calibration equation in this low-CO2 regime is Y = 97.5X1. Solving this equation for the value of Y that prevails when X1 = 5 gives you a value of 487.5 ppm, which is the value that must therefore prevail when X2 = 0. And in the high-CO2 region where solution number two is required, an equation of the form Y = B + 385X2 must be used, as noted previously, which for X2 = 0 yields B = 487.5 ppm, so that the calibration equation in the high-CO2 regime becomes Y = 487.5 + 385X2 in this situation.
In summation, if the 40-ml test volume of water you have exposed to the outside air turns the proper shade of pink when the number of reagent number one drops used does not exceed five, then solve the equation Y = AX1 for A by setting Y = 390 ppm and letting X1 = the number of drops of reagent number one that you used. This procedure gives you the value of A you will use within this equation to evaluate all tests in the low-CO2 regime where no solution number two is required.
Now use this equation with the value of A you have just derived to see what Y would be for 5 drops of reagent number one. Since this is the same situation that prevails when the number of solution number two drops required is zero, you can use the equation Y = B + 385X2 to solve for B under these conditions, which value you will then use with the equation to evaluate all tests in the high-CO2 regime where solution number two is required.
On the other hand, if the 40-ml test volume of water you have exposed to the outside air requires any drops of solution number two to turn it the proper shade of pink, you must reverse the above procedure and first derive the calibration equation for the high-CO2 regime and then the equation for the low-CO2 regime.
Real-World Example
Over the course of several weeks, we have found that water exposed to the outside air in our suburban neighborhood falls right on the border that separates the low-CO2 (reagent number one) regime from the high-CO2 (solution number two) regime of the Tetra Werke CO2 test kit. That is to say, the 40-ml test volume of water turns the proper shade of pink, on average, when 5 drops of reagent number one (and, hence, zero drops of solution number two) are added to it. We have also determined, by independent noon-time measurements over a period of several months, that the CO2 concentration of the outside air in our neighborhood averages 390 ppm. Consequently, the low-CO2 calibration equation appropriate to our local tap water and the specific batch of CO2 test kits we have used may be derived by setting Y = 390 ppm and X1 = 5 in the equation Y = AX1 to find that A = 78 ppm, yielding the equation Y = 78X1. Then, although it is redundant in this particular situation, we solve this equation for Y when X1 = 5, obtaining Y = 390 ppm, which we use in the high-CO2 regime equation Y = B + 385X2 to solve for B when X2 = 0. This procedure gives us a B value of 390 ppm, so that the high-CO2 calibration equation for our local tap water and specific batch of CO2 test kits becomes Y = 390 + 385X2.
Simple Graphical Approach
The real-world example just described is perhaps best understood when the calibration equations are portrayed/derived graphically. 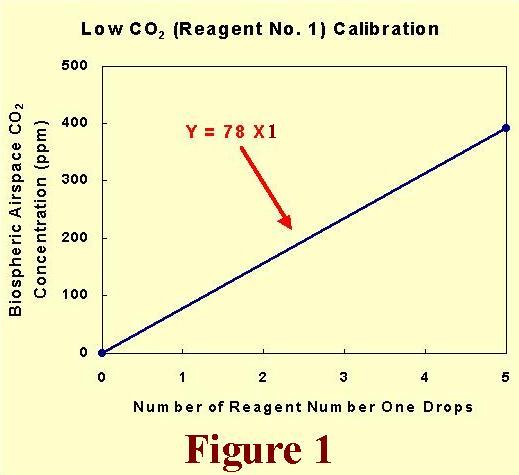 In Figure 1, for example, we have merely plotted the X1, Y point we obtained from our outside water/air measurements (5,390) and drawn a straight line between that point and the origin of the coordinate system (0,0). This line is of the form Y = AX1, which for Y = 390 ppm when X1 = 5 reveals A to be 390 ppm/5 = 78 ppm. Hence, for this low CO2 (reagent number one) regime, the calibration equation is Y = 78X1.
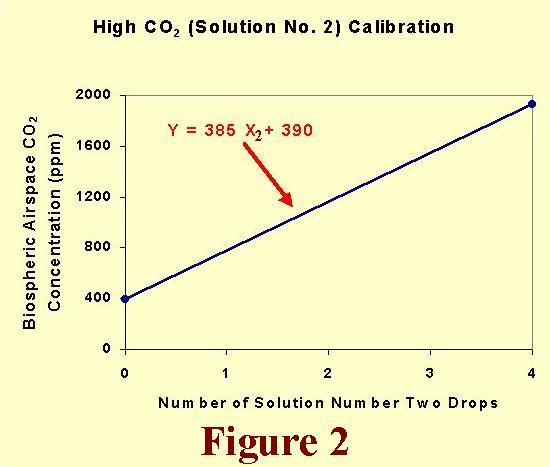 In the high CO2 (solution number two) regime, the calibration equation is of the form Y = B + 385X2. The one point of this line that we know immediately is that which prevails when X2 = 0. It is (0, 390), for the first Y value of this line must be identical to the last Y value of the low CO2 regime line. And this is all we need to know, for when X2 = 0, Y = B; and since this specific value of Y is 390 ppm, B must be 390 ppm, which makes the calibration equation for this high CO2 (solution number two) regime Y = 390 + 385X2. To visually portray this line over the range of CO2 concentrations within which we will typically be working, we have arbitrarily set X2 = 4 (although it could be set equal to anything for this purpose) to calculate a Y value of 1930 ppm. Then we have plotted this point (4, 1930) and connected it by a straight line with the (0, 390) point.
Making Actual Measurements
The process of making a biospheric airspace CO2 concentration determination begins with the withdrawal of water from one of the poor man's biosphere's two internal water reservoirs. 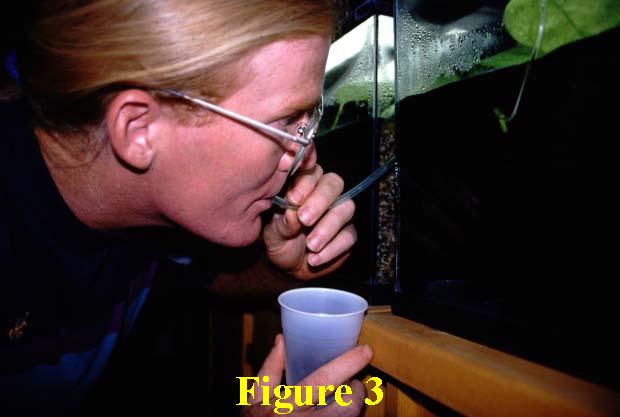 This is done by siphoning water through the silicone air tubing (see Figure 3), which should protrude just far enough below the surface of the water in the reservoir to allow you to siphon approximately 60 ml of the water it contains into a small glass or cup. Then, at a nearby sink, 5 to 10 ml of this water is poured into the test vial, which is capped and shook back and forth a couple of times, after which the water in the vial is poured down the drain.
 With the vial thus "cleansed," it is carefully filled to the 40-ml mark on its side with the water to be tested (Figure 4). Reagent number one drops are then added (Figure 5) until the water either begins to turn pink or a total of five drops are added, at which point the vial is capped and tipped down and up twice.
 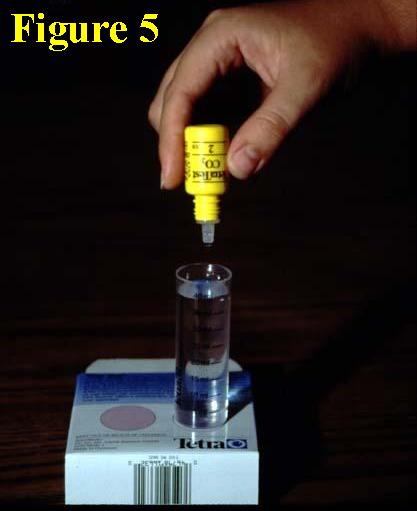 If the latter occurs, i.e., if five drops of reagent number one do not turn the water the proper shade of pink, drops of solution number two should be added until a pink color begins to develop, at which point the vial should again be capped, tipped down and up twice, and placed on top of the back of the test kit box in the location indicated there. Viewing vertically down through the water column of the vial (Figure 6),
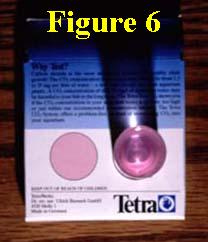 you then have to decide if the water sample is more or less pink than the standard pink circle beside it. If it is exactly the same, the number of drops of either reagent number one or solution number two that caused the color change to occur becomes the value of either X1 or X2 to be used in either the low-CO2 or high-CO2 calibration equation you have derived, which for the real-world example we have just presented is either Y = 78X1 or Y = 390 + 385X2, respectively.
In most of the tests you will perform, however, the first hint of pink will not be of exactly the same intensity as that of the standard color circle on the back of the test kit box. In fact, it will probably be less intense, in which case you will proceed to add the next drop of the proper liquid to the vial (reagent number one, if you have not already added the maximum of five drops, or solution number two, if you have already added five drops of reagent number one). If this next drop does not bring the water sample to the proper shade of pink, continue this procedure until the water either turns the proper shade of pink or (which is actually more likely) it becomes more intensely pink than the standard color circle. When this happens, the value of X1 or X2 (depending on which type of drop was used last) is located somewhere between the two whole numbers or integers that represent the number of drops that almost turned the water sample the proper shade of pink and the number of drops that caused it to exceed the proper shade of pink.
Although it may seem difficult at first, we suggest that you try to specify drop numbers to the nearest tenth, that is, to one decimal place. If, for example, the water in the test vial was almost the proper shade of pink with four drops of reagent number one, and the fifth drop made the color much deeper or more intense than the standard, the proper X1 value for this test might be 4.1 or 4.2. On the other hand, if the water in the test vial showed just a hint of pink with one drop of solution number two, and a second drop made it just slightly more intense than the pink standard, the proper X2 value for this test might be 1.8 or 1.9.
Continued experience with the technique will give you confidence in your ability to make these determinations. Individual results will obviously have a certain amount of error associated with them; but when you average the results of an entire experiment to obtain a single CO2 value for each of your poor man's biospheres, the mean results will be very good. We know it, because we've done it.
Notice
We have just learned that the Tetra Werke company is in the process of redesigning their test kit product line and may possibly discontinue production of their CO2 test kit altogether. Because of problems associated with this development, we have not been able to acquire the kits from any source in recent days; and we have been told that even if the kit is again released to the public, it will not become available until some time in the first quarter of 1999.
In the mean time, we are studying the suitability of other CO2 test kits. When we have identified one or more that meet our needs, we will announce that fact and simultaneously launch our second experiment, which is much less costly than the current experiment and requires much less space. Hence, as we have stated in the Center Experiment #1 Introduction, it may be wisest yor you to merely observe how our first experiment goes before attempting to work along with us in real time.
The LaMotte CO2 Test Kit
If Tetra CO2 test kits are unavailable, we have determined that the LaMotte CO2 test kit can be used in its place. The LaMotte test kit uses only half as much water as the Tetra test kit (20 ml vs. 40 ml); and it only uses two drops of reagent number one, as opposed to the Tetra test kit's five drops. From this point on, however, both kits appear to perform identically. If the Tetra test kit requires 2.2 drops of solution number two to turn its water sample the appropriate shade of pink, so will the LaMotte test kit require 2.2 drops of solution number two to turn its water sample the same color. One complexity with respect to this fact is that the LaMotte test kit does not currently come with a standard pink comparison circle. Hence, you will have to construct one yourself, at least for the time being. If the LaMotte company makes any changes in this regard, we will post a notice of it here.
When used analogously to the Tetra CO2 test kit, the appropriate calibration equations for the LaMotte CO2 test kit, which correspond to the Tetra test kit's equations of Figures 1 and 2, are:
the second of which equations is identical to the second equation for the Tetra test kit.