


Final Results
Final Results: Part 1
 Harvesting the plants that grew in the bulk gravel of the tanks was fairly easy. We would start from one side and push one hand down to the bottom of the tank and then slide it under the root system of the closest plant and carefully lift upward, while at the same time grasping the plant's vine with the other hand and wiggling it to free its roots from the gravel.
 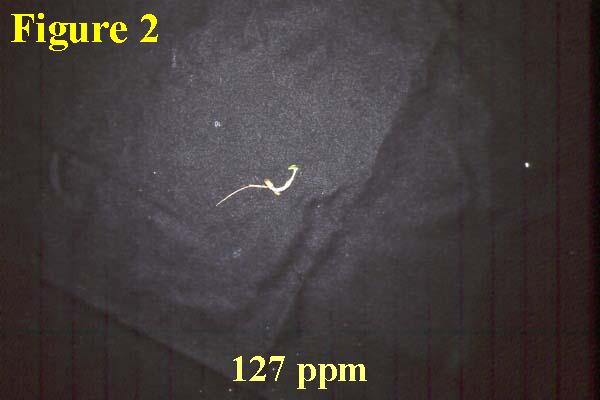 In some cases the entire plant would be freed by this one maneuver. In cases of very large plants with extensive root systems, however, we would often have to repeat this procedure from several different angles in order to extract the plant without breaking any of its roots.
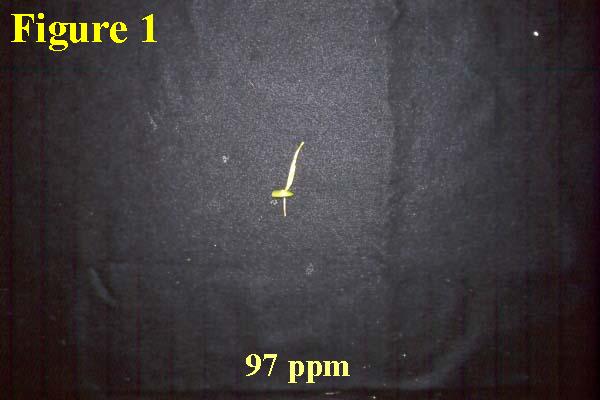
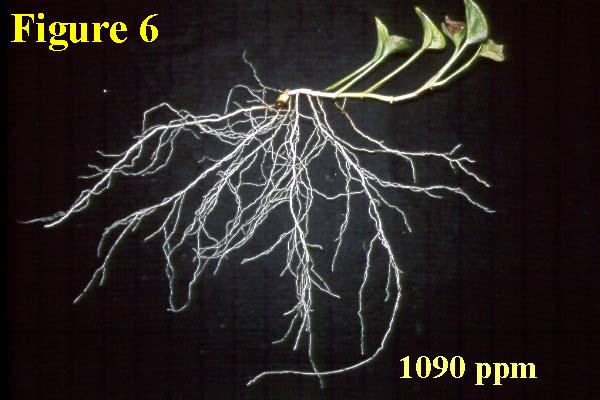
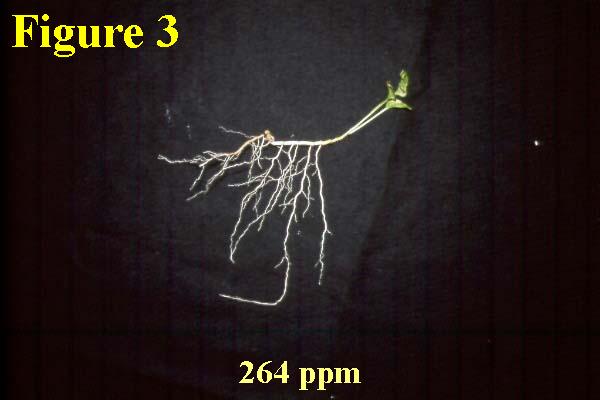 Upon freeing a plant, we would swish it around in a bucket of water to remove any remaining pieces of gravel from its roots, after which, for the purposes of our web site, we would place the plant on a piece of black velvet and photograph it.
 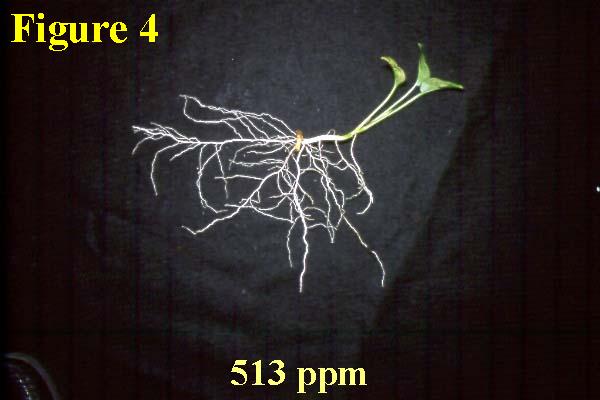 Figures 1-6 depict average-size plants thus obtained from the bulk gravel of each of our six tanks.
 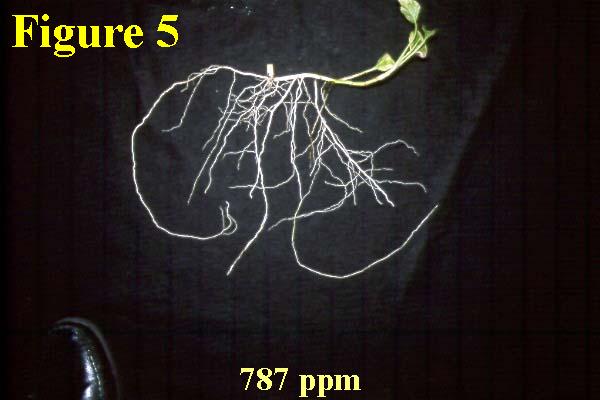 Then we would remove the black felt material from the front of each tank and carefully cut away the plant roots that clung to its fibers, as shown in Figure 7.
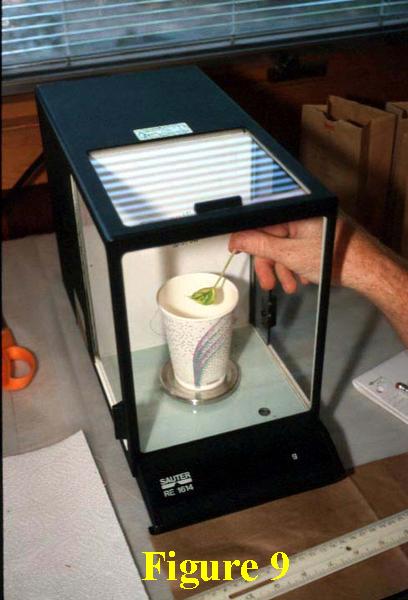
 The next thing we did was measure the length of every primary, secondary and tertiary root on each plant, after which we quickly obtained the fresh weights of all roots in each category before they began to dry out.
 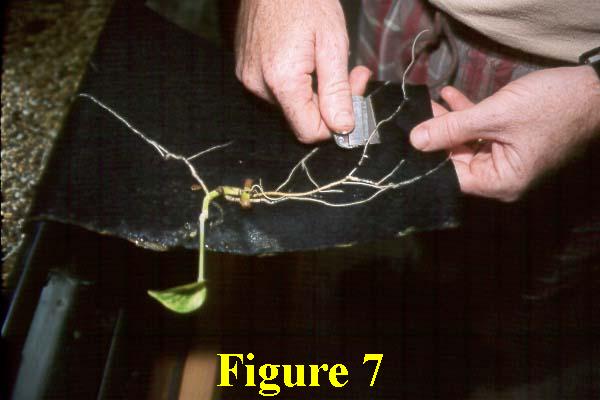 For large plants, this weighing procedure was performed a few roots at a time, while the plant was suspended with its remaining roots in a bucket of water to keep them from shriveling up and loosing weight.
 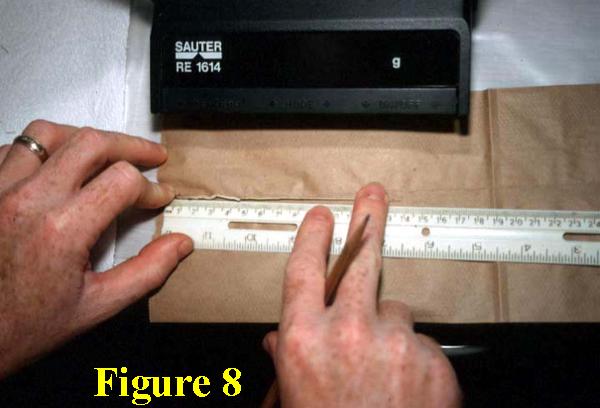 Figures 8-10 show one of us (KEI) engaged in this measuring and weighing process.
 When all of a plant's roots were thus weighed, we weighed each of the new leaves it had produced, as well as its new vine.
 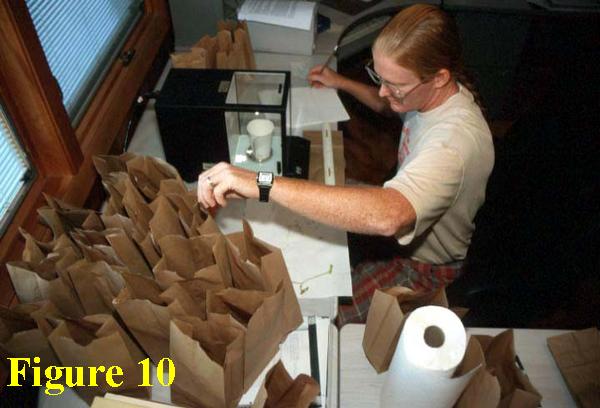 All leaves, vines, and roots of each category for each tank were then put in separate small paper bags (one bag for all specimens of each plant part from each tank) and left open to dry for a few days, after which we put them in an oven and dried them for another day at approximately 60°C (140°F).
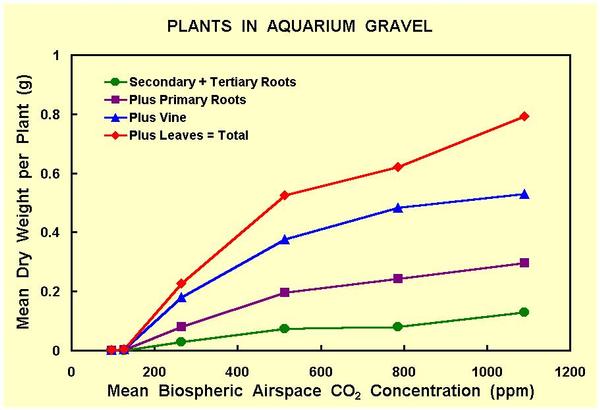 The plant dry weights thus obtained define the primary results of the experiment, which are depicted in Figure 11. As can be seen there, all plant parts contribute in a well-defined manner to the total response of the Pothos plant to atmospheric CO2 enrichment. In the case of the plants that were sandwiched between the front glass of the aquariums and the black felt, however, Tank 5 gave an anomalous result, as shown in Figure 12.
 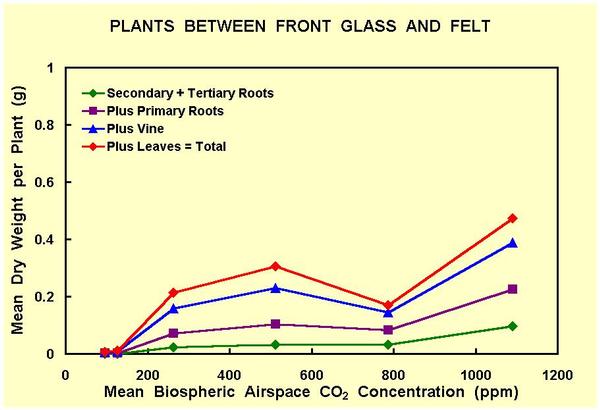 It is also evident from comparing Figures 11 and 12 that the growth of the plants between the glass and the black felt was severely repressed by this artificial constriction of the plants' root systems. And perhaps this is the reason for the ultra-poor response of the plants of Tank 5; they may have been situated in such a way as to experience this stress even more than the corresponding plants in the other tanks. Then again, strange things periodically occur when one is working with living systems.
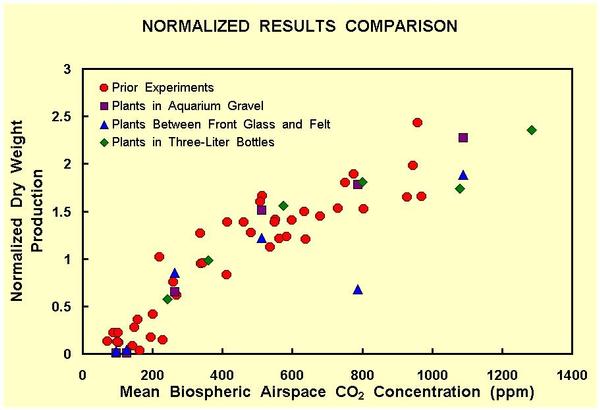 Before concluding, it is always interesting in doing an experiment of this type to see how one's results compare with those of others. Hence, in Figure 13 we have assembled the total plant dry weight results of this experiment and plotted them together with those of Experiment #2 and the results of a number of similar experiments performed by Idso (1997). Before constructing this graph, however, the data of each experiment had to be normalized in some way. We normalized our data by utilizing the straight lines of Figures 11 and 12 that connect the total dry weight results of Tanks 3 and 4 to determine the mean dry weight per plant that would be predicted for Pothos plants growing in a poor man's biosphere maintained at 365 ppm CO2 (chosen to approximately represent today's mean atmospheric CO2 concentration). The entire suite of results obtained from each set of experimental plants (those in the bulk gravel and those sandwiched between the glass and black felt) were then divided by the appropriate predicted value thus obtained from either Figure 11 or 12 and plotted together with the similarly normalized results obtained from experiment #2 and the experiments of Idso (1997).
As can be seen from the multi-experiment plot thus obtained by this means (Figure 13), all of the results of all of the separate experiments are clearly compatible with each other, except for the two plants that were sandwiched between the glass and black felt of Tank 5. 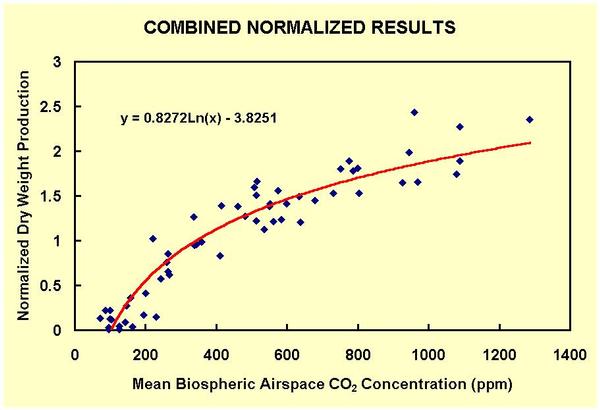 But, hey, that's life; and as we noted earlier, when you work with living systems, aberrations are to be expected now and then. And one fluke out of 60 is not too shabby. Hence, we have deleted this one aberant point and fit a line to the remaining data points to describe the overall relationship, the results of which are presented in Figure 14.
In considering the implications of the relationship depicted in Figure 14, it can be seen that the growth of the Pothos plant drops off rapidly as the air's CO2 content falls below the atmosphere's current mean value of 365 ppm, where we have constrained it to have a value of 1.00 or unity. At half the air's current CO2 concentration (182 ppm, typical of the earth's atmosphere at the peak of the last great ice age), for example, the growth rate of the Pothos plant is approximately half of what it is under current conditions, with death occurring at a CO2 concentration of about 100 ppm; while at double today's atmospheric CO2 concentration (730 ppm) the growth rate of the Pothos plant is approximately 63% greater than it is under current conditions. Clearly, the increase in atmospheric CO2 that accompanied the demise of the last great ice age was a godsend for the Pothos plant, as it was for most of the planet's other plants as well. And a further increase in the air's CO2 content would supply even more benefits.
Reference
Idso, S.B. 1997. The poor man's biosphere, including simple techniques for conducting CO2 enrichment and depletion experiments on aquatic and terrestrial plants. Environmental and Experimental Botany 38: 15-38.